Control Your Destiny with Customizable Machine Analytics
- Daymon Thompson

- Mar 27, 2023
- 6 min read
TwinCAT Analytics offers standard, drag-and-drop functionality that allows engineers to optimize machine performance on their own terms
Have you ever read one of those “choose your own adventure” books? You could skip ahead and essentially create your story how you wanted to – or based on what you had time to fit in. “Does the hero escape the danger? Skip to page 200.” Something like that.
The intralogistics market, with its constant explosive growth, often feels like one of those books. There’s no one-size-fits-all solution. You have to make your choice quickly and move forward. Otherwise, you fall behind. And automated equipment – from company to company, even site to site – needs to offer flexibility and adaptability to achieve peak performance.
However, analytics software for distribution and fulfillment centers rarely supports such dynamic requirements. The software options typically only report on overall productivity with a maximum granularity of 1 second, more often 5 or even 10 seconds. This works well for reporting on business goals and comparing performance across multiple sites. But for understanding machine health and optimizing line performance, engineers need more options to augment the higher-level offerings.
Whether you’re a machine builder OEM or equipment end user, TwinCAT Analytics software offers unique advantages. Engineers can use the Beckhoff solution to optimize commissioning time, machine efficiency, predictive maintenance and fast troubleshooting of intralogistics systems. TwinCAT Analytics enables users to select from a toolbox of more than 90 algorithms to help quickly find insights within the data. It supports a wide array of options for collecting and sharing data and generates a robust dashboard with one click.
We designed TwinCAT Analytics to be inherently flexible, to let you choose your own adventure and implement analytics with real insights on your own terms. Let’s explore the choices available with this approach.

Where can you gather data from?
The power of Beckhoff machine controllers and the high data throughput of EtherCAT mean you can acquire data from many sources with incredible granularity.
PLC: Log cyclical data at microsecond rates and scope for machine optimizations or troubleshooting.
Measurement terminals: Gather even more specific data from wide-ranging sensors using EtherCAT Terminals in the ELM series, among others.
Machine vision: Vision is becoming more important to industrial applications. The ability to add vision results into scoped data brings very powerful benefits to troubleshooting and diagnostics and will continue to become more widely used as the technology evolves. The TwinCAT Vision solution allows you to embed timestamped images to your machine data either at a specified interval or when a trigger occurs.
Devices on other networks: The Beckhoff system architecture is designed to maximize openness, allowing simple connection of more than 30 common protocols. That allows for implementation of mixed architectures in greenfield applications as well as gathering data from legacy equipment in brownfield warehouses.
TwinCAT analytics can access, log and analyze data from nearly anything related, or running in the TwinCAT runtime, or data from any device capable of exposing data via an OPC UA server.

How can you access the data?
While many operations are becoming more comfortable with edge or cloud computing technologies, many others require zero connectivity to equipment on the warehouse floor. TwinCAT Analytics supports these and other paradigms:
Cloud or edge: Our controllers offer built-in cloud connectivity, so they can easily communicate data directly to AWS, Microsoft Azure or many other cloud platforms. We can then analyze the data in TwinCAT. Only want to send select data to mitigate bandwidth issues or perform some preprocessing at the edge before sending? Our controllers can do that.
Local network: Maybe you don’t want to connect to the cloud, but you have an enterprise-level system that would be ideal for communicating data. We support open standards for sending machine data to these layers.
Local controller: If your systems operate as islands of automation with absolutely no connectivity to higher levels, our “flight recorder” solution is ideal. This can log every PLC cycle’s data, including information on motion control, fieldbus diagnostics, etc., for a user-defined amount of time in a ring buffer. For example, you could log hundreds of variables every PLC cycle for 24 or 48 hours. So, if there’s an issue, the end user can easily send the file for the machine builder’s support team to analyze, diagnose and even send a program update that can be installed just as easily. A hybrid approach that is also available involves using the flight recorder to send data of every PLC cycle to a local network archive or even a cloud archive, as long as there is enough bandwidth available.
What analysis options are available?
TwinCAT Analytics offers more than 90 algorithms as well as the option to incorporate custom algorithms or even AI-based functions.
TwinCAT 3 Analytics Library: This standard toolbox offers function blocks with simple and complex functions – from edge counters and lifetime monitoring to mathematical functions and envelope curve monitoring, as well as correlation functions, Den-Stream algorithm and linear regression. The function blocks support object-oriented programming in IEC 61131-3.
Graphical Analytics: These libraires are available to use within PLC code, or from the easy drag-and-drop graphical environment of the TwinCAT Analytics Service Tool and TwinCAT Analytics Workbench. These analytics tools are combined with TwinCAT Scope/Measurement for a graphical view of analytics algorithm outputs and analyzed data sets.
Machine learning (ML): Optimizing machine performance becomes tricky when complex motion or decisions with 10-plus variables are involved. Beckhoff offers the ability to train ML models in TwinCAT Machine Learning and run them on the controller in real time. An algorithm trained in ML could be dropped into TwinCAT Analytics, for example, to perform monitoring for predictive maintenance.
How can you visualize the data?
The Beckhoff solution offers several ways to visualize the data in real time and to generate reports for recordkeeping.
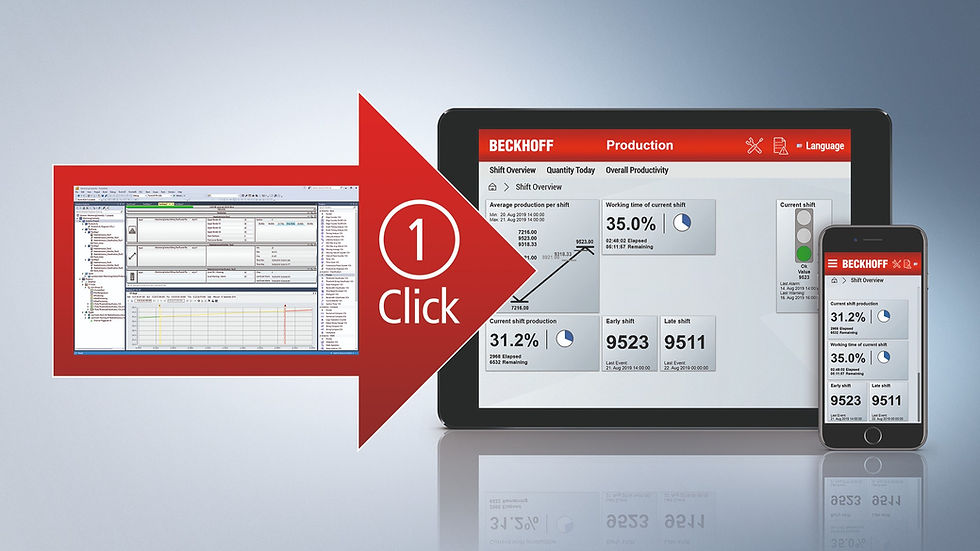
One-Click Dashboard: Our no-code dashboard allows you to drag and drop the variables that you want to see to continuously visualize machine conditions, analysis results and even Overall Equipment Effectiveness (OEE). With simple integration into TwinCAT HMI, you can display both live and historical data side by side, along with a range of new interactive functions for further customization. Users can also adjust the display format in the chart and switch from line to bar charts or similar representations without accessing the engineering environment.
Reporting: TwinCAT Analytics allows you to output data, e.g. at regularly scheduled intervals or when an alarm is triggered, to a standardized PDF, JSON or HTML file format. This functionality efficiently summarizes raw or processed data into reports in an automated way (it can be automatically emailed). It also supports customization for parameters and branding, such as company-specific headers, test or batch information, and user data listed in tabular form, charts or simple labels.
Two possible adventures in analytics
Sound interesting? Let’s take a look at two use cases, one advanced and another that’s more standard.
First off, the advanced scenario: Consider a fulfillment center with an AS/RS, no shortage of conveyors and a right-size-packaging system. You want to accurately calculate OEE on these systems. The engineering team also wants to implement predictive maintenance across all equipment and reduce wear and energy consumption on the AS/RS specifically. Using TwinCAT Analytics, the controls engineers can share data from a local analytics server to the cloud. With the One-Click Dashboard, they can visualize OEE, drawing from devices on the main EtherCAT network as well as others on CANopen and EtherNet/IP using the appropriate gateways. By analyzing vibration on the conveyors, as well as power consumption of MDR controllers, they can identify irregularities and schedule maintenance before anything fails. With a trained ML model, the AS/RS shuttles can adjust acceleration and deceleration rates to increase product life cycles, reduce energy requirements and, as a result, extend the mean time between repairs.
What about a less complex but also beneficial use of machine-level analytics? Let’s consider a robotic palletizing system that runs 24/7. It operated normally throughout the day, but in the middle of the night, it faulted and needed to be reset. This distribution center allows no connectivity on the production floor. The local maintenance staff can plug in a laptop to the controller, export the current file from the TwinCAT Analytics flight recorder and send it to the controls engineering team at the OEM. The engineers can then use the TwinCAT Analytics Service Tool to examine the data from many sources in the controller around the time of the fault. They can then identify the issue and send a code update or advise the maintenance team of a problem at the warehouse (e.g. power quality, a team member that tried to bypass safety measures, etc.) that needs to be addressed. Being able to access data at or near PLC update rates means the diagnosis can check each state in PLC code state machines to help programmers identify exactly what step each machine process was in at the time of the fault. The power of TwinCAT Analytics and the Analytics Workbench really shines in scenarios such as this when the machine exhibits undesirable or “strange” behavior, but never throws an alarm or fault message.
The increasing requirements in intralogistics facilities call for greater customization in analytics. By leveraging the flexible options in TwinCAT Analytics, machine builders and onsite staff triumph in achieving peak performance.
Thinking about taking the next step with machine analytics at your distribution center? Reach out to your local Beckhoff sales engineer today.

Daymon Thompson is the Director of Product Management at Beckhoff Automation LLC


Comments